Key Events for the Month of June 2024
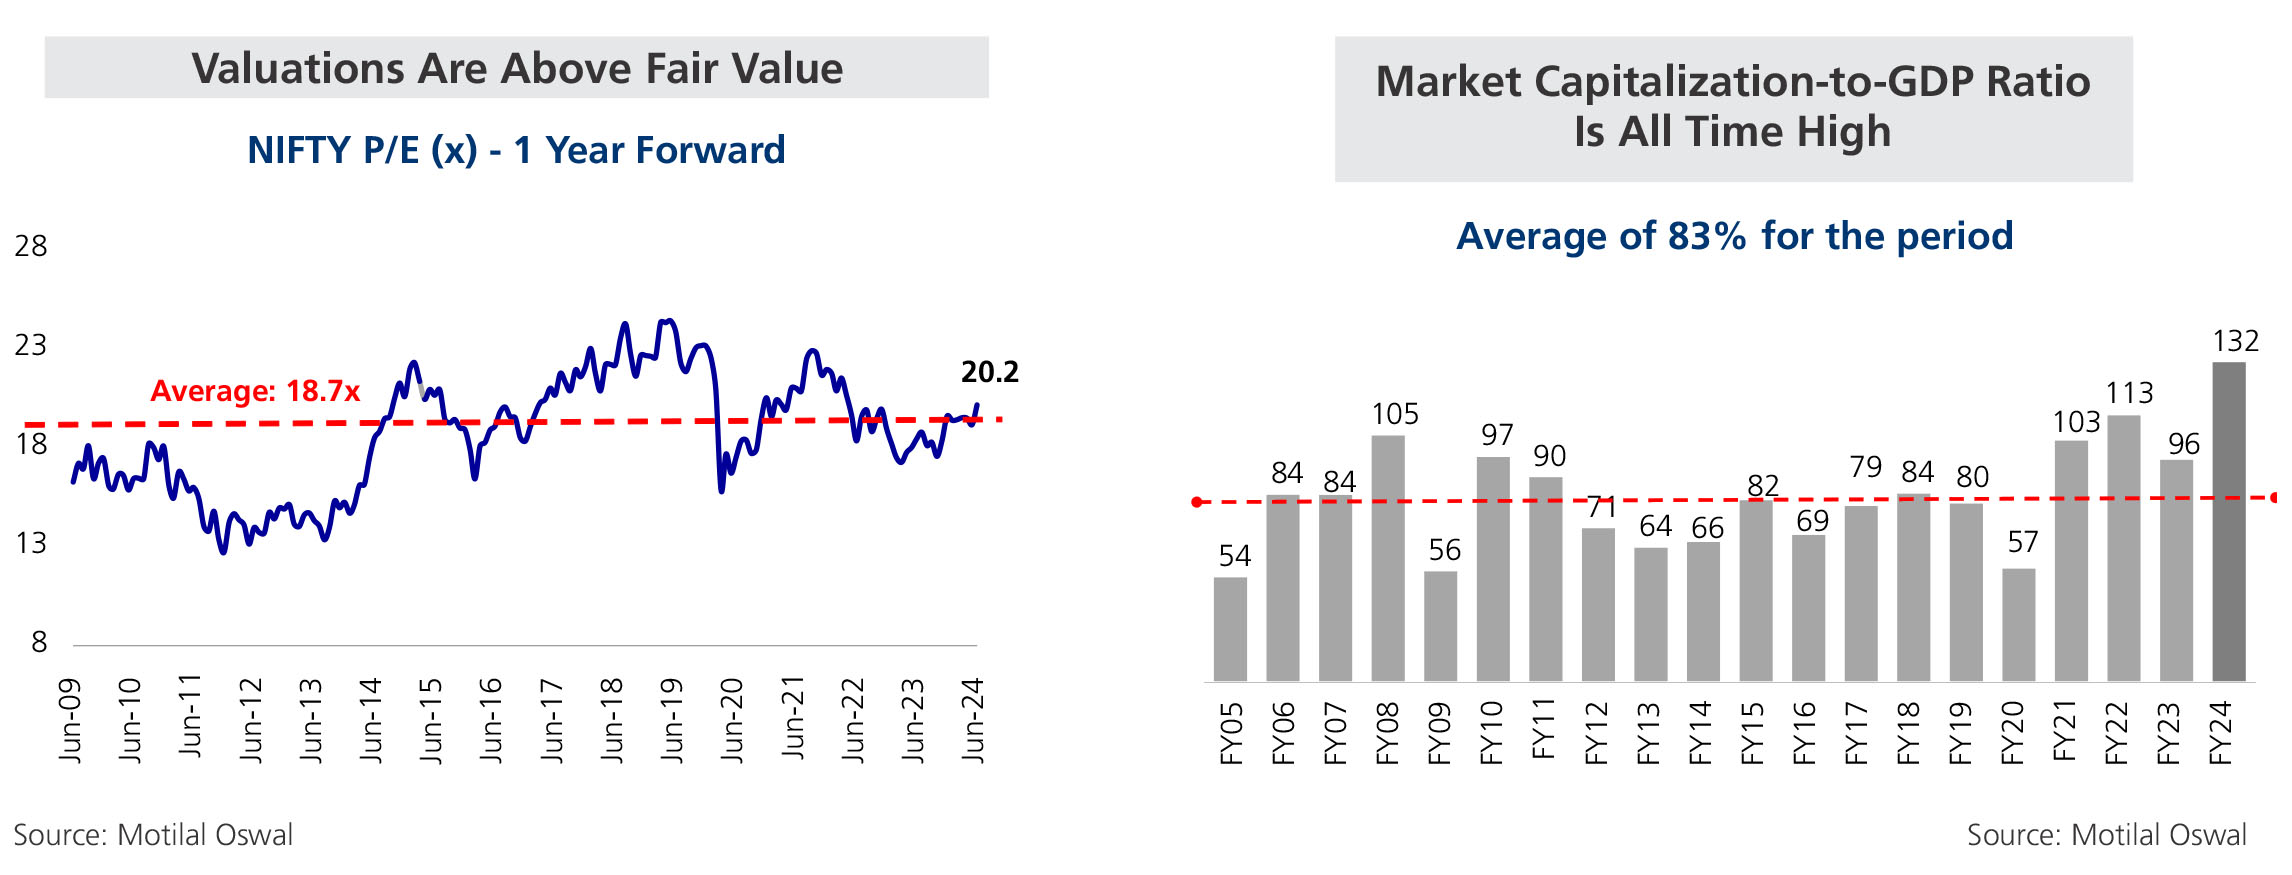
• In June, the Indian equity market reversed last month's declines as the Nifty 50 surged, recording gains of 6.57%.
• Current account deficit improved to 0.7% of GDP ($23.2 billion) in FY24, down from 2% ($67 billion) the previous
year, attributed to a decrease in the merchandise trade deficit.
• RBI kept key interest rates unchanged for the eighth consecutive meeting, maintaining its inflation projection at
4.5% and raising the FY25 growth forecast to 7.2% from 7%.
• GST collection reached Rs 1.74 trillion in June, a 7.7% year-on-year increase, bringing the total for the current fiscal
year to Rs 5.57 trillion.
• Manufacturing growth slowed to a three-month low in May, with the PMI dipping to 57.5 from 58.8 in April due to a
heatwave reducing working hours.
• India’s Services PMI fell to 60.2 in May from 60.8 in April, marking a five-month low in services activity growth du
to weakened domestic demand.
• In May 2024, India's CPI inflation decreased to a one-year low of 4.75% year-on-year, slightly down from April's
4.8%.
• WPI inflation surged to 2.61% in May 2024, marking the highest rate in 15 months since February 2023.


| |
Sectoral Index Performance |
| Name | 3 Months | 6 Months | 1 Year | 3 Years | 5 Years |
| Nifty Auto Index | 17.7% | 36.9% | 69.8% | 33.0% | 26.0% |
| Nifty Bank Index | 11.1% | 7.9% | 18.1% | 14.0% | 11.0% |
| Nifty Energy Index | 7.1% | 23.9% | 70.2% | 28.1% | 21.1% |
| Nifty Financial Services Index | 11.6% | 8.8% | 17.7% | 12.0% | 11.5% |
| Nifty FMCG Index | 5.2% | 0.4% | 9.4% | 16.3% | 13.9% |
| Nifty Healthcare Index | 4.3% | 17.9% | 41.9% | 13.0% | - |
| Nifty Infrastructure Index | 9.6% | 24.9% | 60.3% | 27.9% | 22.0% |
| Nifty IT Index | 3.6% | 1.3% | 25.4% | 7.5% | 17.8% |
| Nifty Media Index | 10.9% | -16.3% | 14.4% | 3.0% | -0.5% |
| Nifty Metal Index | 18.9% | 23.8% | 58.0% | 22.8% | 26.9% |
| Nifty Pharma Index | 3.9% | 17.0% | 44.8% | 11.5% | 19.6% |
| Nifty Psu Bank Index | 5.1% | 28.1% | 82.9% | 42.1% | 18.1% |
| Nifty Realty Index | 22.7% | 42.1% | 113.6% | 47.1% | 31.1% |
| BSE Consumer Durables Index | 12.5% | 17.6% | 37.9% | 18.2% | 17.6% |
| BSE Industrial Index | 24.1% | 35.7% | 85.6% | 48.9% | 37.2% |
| |
Global Index Performance |
| Name | 3 Month | 6 Month | 1 Year | 3 Years | 5 Years |
| MSCI World | 2.2% | 10.5% | 20.1% | 5.1% | 10.0% |
| MSCI Emerging | 4.4% | 6.2% | 9.5% | -7.7% | 0.6% |
| MSCI India index | 9.9% | 16.7% | 36.7% | 16.6% | 16.8% |
| Dow Jones Industrial Average | -1.7% | 3.7% | 15.6% | 4.5% | 8.0% |
| Nasdaq Composite Index | 8.3% | 17.5% | 30.5% | 6.9% | 17.2% |
| Nikkei 225 | -1.5% | 18.0% | 19.2% | 10.9% | 13.2% |
| Shanghai Composite | -1.4% | 0.4% | -7.0% | -6.3% | -0.1% |
| Deutsche Boerse AG german Stock Index DAX | -1.4% | 9.2% | 14.3% | 5.4% | 8.0% |

